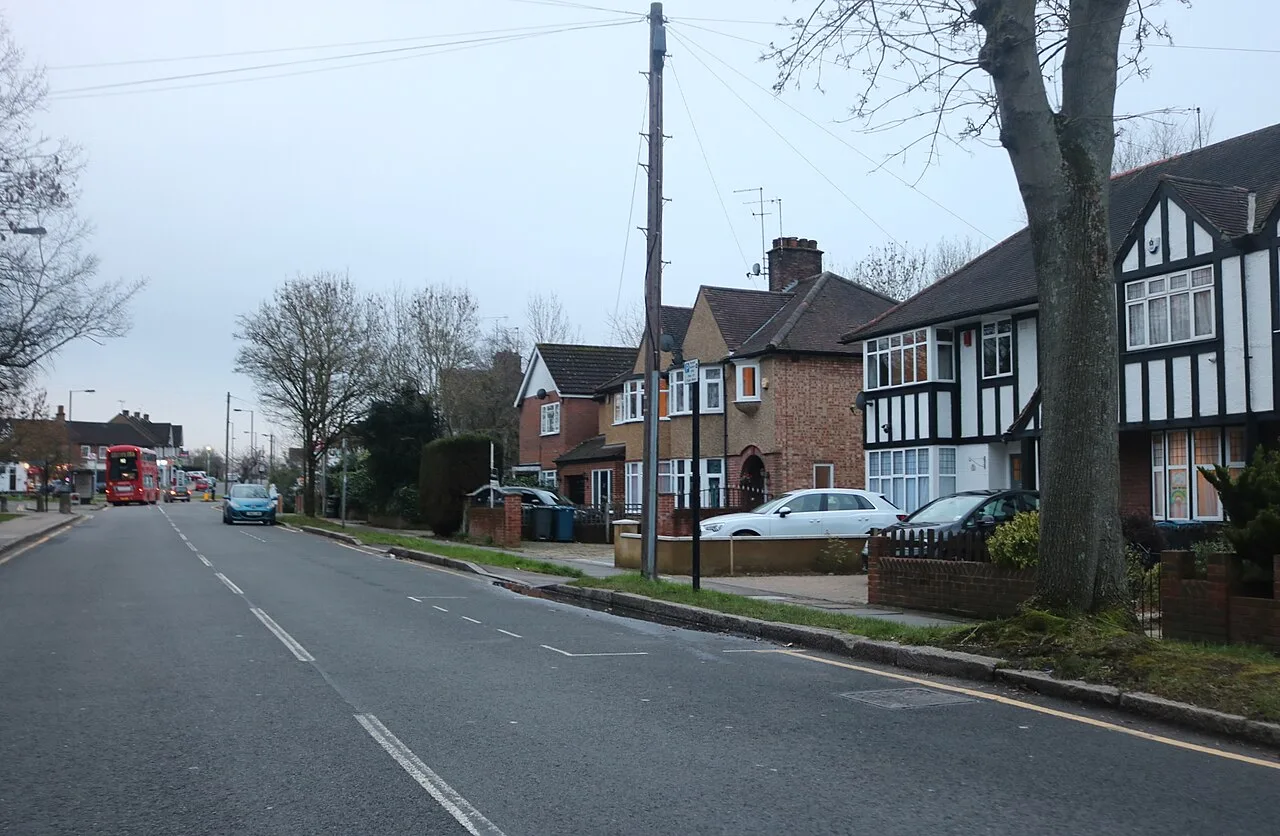

The average Harrow home sold for £531,211 in September 2026, almost exactly where it was in August.
Over the year it is down 1.4 per cent, or £7,475. That is a smaller fall than in July or August. But three of Harrow’s four London neighbours have moved the other way: Brent, Ealing and Hillingdon all rose over the same year.
The figures come from the UK House Price Index for September 2026, which HM Land Registry published this morning. The index counts completed sales, not asking prices. It reports a mean average, not a median, so a few very expensive sales can lift it.
Overview
- Average price: £531,211, down 0.1 per cent on August and 1.4 per cent on September 2025.
- Flats: £318,856, down 3.9 per cent, the weakest type again.
- Semi-detached: £672,648, up 0.2 per cent, the only type higher than a year ago.
- London: down 3.5 per cent, so Harrow fell less than the capital.
- August revised down: to £531,528, from the £532,173 we reported last month.
Harrow in September, by property type
| Type | Average price | Change on a year |
|---|---|---|
| Detached | £1,213,168 | -0.7% |
| Semi-detached | £672,648 | +0.2% |
| Terraced | £543,844 | -0.2% |
| Flat or maisonette | £318,856 | -3.9% |
| First-time buyer | £437,187 | -1.6% |
| All property | £531,211 | -1.4% |
Semis, the 1930s houses that make up so much of Rayners Lane, Kenton and North Harrow, edged back above last year’s level. They had been below it in June, July and August.
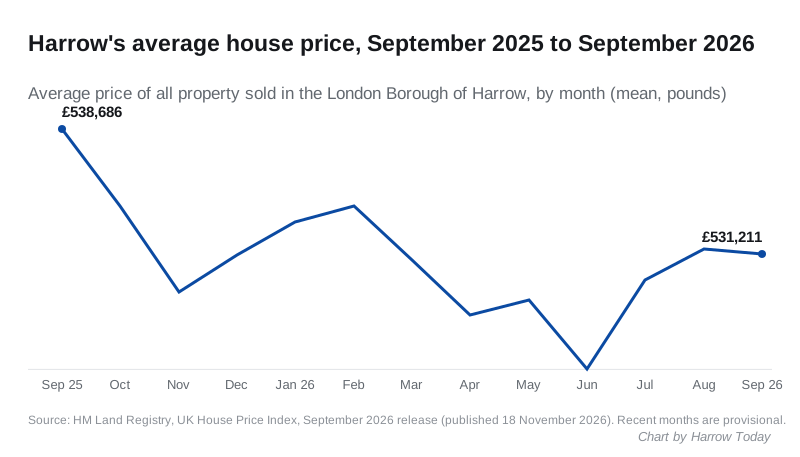
The borough average has moved inside a narrow band all year. It touched £524,288 in June and has since recovered most of the way to last autumn’s level.
Flats are still cheaper than five years ago
A Harrow flat averaged £318,856 in September. That is £13,097 less than a year earlier.
It is also £4,861 below September 2021, when the average flat cost £323,717. The peak was £354,161 in August 2022.
Harrow against its neighbours
| Borough | Average, September 2026 | Change on a year |
|---|---|---|
| Barnet | £592,919 | -3.2% |
| Ealing | £578,526 | +1.3% |
| Brent | £567,223 | +1.1% |
| Harrow | £531,211 | -1.4% |
| Hillingdon | £480,044 | +1.3% |
| London | £545,579 | -3.5% |
Across the capital, 22 of the 33 areas fell over the year. The biggest falls were in central London: Westminster down 18.5 per cent, the City of London 17.3 per cent and Kensington and Chelsea 15.6 per cent. Barking and Dagenham rose most, by 5.1 per cent.
Harrow’s fall was the 19th steepest of the 33. Flat prices fell in every London borough except Barking and Dagenham.
August has been revised down
When we reported the August figures last month, the index put the Harrow average at £532,173. The September release restates August as £531,528, £645 lower. July has moved again too, to £529,676.
The index revises recent months as more completed sales reach the Land Registry. Any single month is provisional for two or three releases.
What it means for you
- If you are selling a flat, price against flats, not the borough average. Flats are down 3.9 per cent on the year; houses are within 1 per cent either way.
- If you are a first-time buyer, the average first-time purchase cost £437,187 in September, 1.6 per cent less than a year before.
- Of Harrow’s four London neighbours, only Hillingdon is cheaper, and the gap with Brent and Ealing widened this year because they rose while Harrow fell.
- These are borough-wide averages. The index does not publish separate figures for Pinner, Stanmore or individual wards.
HM Land Registry is due to publish the October figures in December.
Sources
- HM Land Registry, UK House Price Index for September 2026, published 18 November 2026
- HM Land Registry, UK House Price Index full data file, September 2026, for Harrow, its neighbours, London and the borough ranking
- HM Land Registry, UK House Price Index, Harrow
Have your say