
8,375 Harrow residents were claiming unemployment-related benefits in August, 4.8% of 16 to 64s. Brent, Barnet, Ealing and Hillingdon are all higher.
8,375 people in Harrow were claiming benefits principally because they were out of work in August 2026, the Office for National Statistics has reported.
That is 4.8 per cent of residents aged 16 to 64. It is the lowest rate of any London borough that borders Harrow, and below the London rate of 5.5 per cent. It is still above the UK rate of 3.9 per cent (ONS claimant count via nomis, last updated 15 September 2026).
The count was 25 higher than in July, when it stood at 8,350. It was 70 lower than in August 2025, when it was 8,445.
Harrow and its neighbours
Harrow borders four London boroughs and two Hertfordshire districts. The four London neighbours all have a higher rate. The two Hertfordshire districts are lower.
| Area | Claimants, August 2026 | Rate |
|---|---|---|
| Brent | 17,475 | 7.2% |
| Ealing | 16,995 | 6.4% |
| London | 347,135 | 5.5% |
| Barnet | 13,125 | 5.0% |
| Hillingdon | 10,860 | 5.0% |
| Harrow | 8,375 | 4.8% |
| United Kingdom | 1,698,450 | 3.9% |
| Hertsmere | 2,465 | 3.6% |
| Three Rivers | 1,615 | 2.7% |
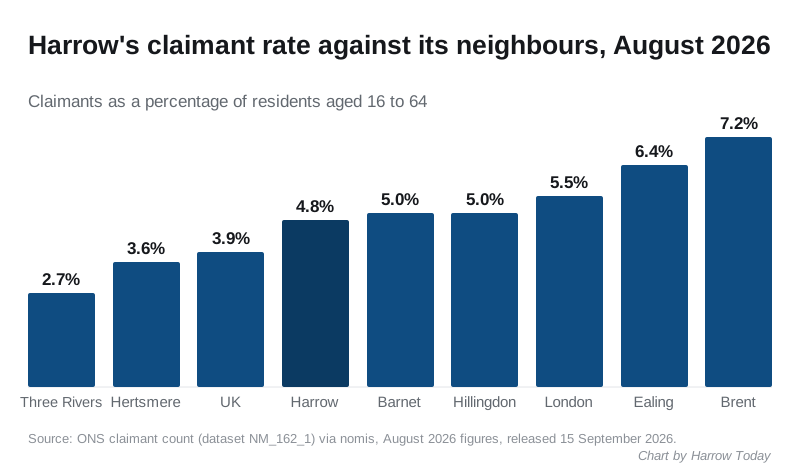
Across all 33 London local authorities, Harrow sits in the lower half. Twelve have a lower rate, Hammersmith and Fulham matches it at 4.8 per cent, and twenty are higher (ONS via nomis, all London boroughs). The City of London has the lowest rate, at 1.1 per cent. Barking and Dagenham, Haringey and Newham share the highest, at 7.4 per cent.
The number that has not gone back down
Month to month, the figure barely moves. Over a longer run it has changed a great deal.
In August 2019 Harrow’s claimant count was 3,060. It is now 8,375, more than two and a half times as many people.
- The pandemic took it from 3,435 in March 2020 to a peak of 11,605 in February 2021.
- It fell steadily to a low of 5,695 in November 2022.
- It then crept up through 2023 and the first half of 2024, to 7,030 in June 2024.
- In July 2024 alone it rose by 1,010, to 8,040. The London total jumped by about a ninth in the same month, so this was a capital-wide step, not something peculiar to Harrow.
- Since then it has stayed between 7,930 and 8,800. The most recent low was 8,000 in December 2025. Every month since has been higher.
Who is claiming
Split by age, the past year’s changes run in different directions.
| Age band | August 2025 | August 2026 | Change |
|---|---|---|---|
| 16 to 24 | 1,050 | 1,105 | up 55 |
| 25 to 49 | 5,315 | 5,145 | down 170 |
| 50 and over | 2,085 | 2,125 | up 40 |
So the small fall in the total hides a rise among the youngest and oldest claimants. People aged 25 to 49 make up about three in five of the total, and their fall is what pulled the figure down.
Of the 8,375 claimants in August, 4,635 were men and 3,740 were women. A year earlier the split was 4,610 men and 3,835 women.
The ONS does not publish a claimant rate for individual age bands, only counts. So there is no under-25 rate to quote from this table.
What this number is, and what it is not
This is often reported as an unemployment figure. It is not one. The ONS says so in its quality and methodology information:
“The Claimant Count does not attempt to measure unemployment, which is a concept defined by the International Labour Organisation (ILO) as all those who are out of work, actively seeking work and available to start work.”
What it does measure is “the number of people claiming benefits principally for the reason of being unemployed, based on administrative data from the benefits system”. It combines Jobseeker’s Allowance claimants with Universal Credit claimants who must look for work to qualify. That second group includes some people who already have a job but earn little enough that the conditions still apply.
The same ONS page says “the UC element of the Claimant Count allows for revisions to the data for one previous month”. So July’s 8,350 may still move when the September figures are published.
What it means for you
The figures cover the whole borough: Harrow, Wealdstone, Pinner, Stanmore, Kenton, Rayners Lane, Hatch End and the rest. This table does not break them down by town or ward, so it cannot tell you the figure for your part of the borough.
If you are looking for work, the council runs Work Harrow, which it describes as “a free training and employment service for unemployed people in Harrow”. It lists live vacancies and takes registrations for support.
Learn Harrow also has City Hall money for free vocational courses in care, business admin and classroom support. We covered how to book an assessment in our report on the £1.4m course fund.
Council tax support is means tested and separate from the claimant count. Our guide to Harrow council tax bands sets out what each band costs before any discount.
The ONS publishes the September figures in October. We will report them when they land.
Sources
- ONS claimant count by sex and age, dataset NM_162_1 via nomis, last updated 15 September 2026, for every figure in this article
- ONS, Claimant Count quality and methodology information, for what the count measures and the revisions rule
- Harrow Council, Work Harrow
Have your say